Safe People
The most vulnerable roadway users are the ones outside of vehicles. Over the last decade, the number of people killed while walking, biking, or on a motorcycle has only increased. Safe People brings together experts in roadway design and driving behavior to develop strategies to reduce the risk to bicyclists, pedestrians, motorcyclists, roadway crews and first responders, as well as older and younger drivers.
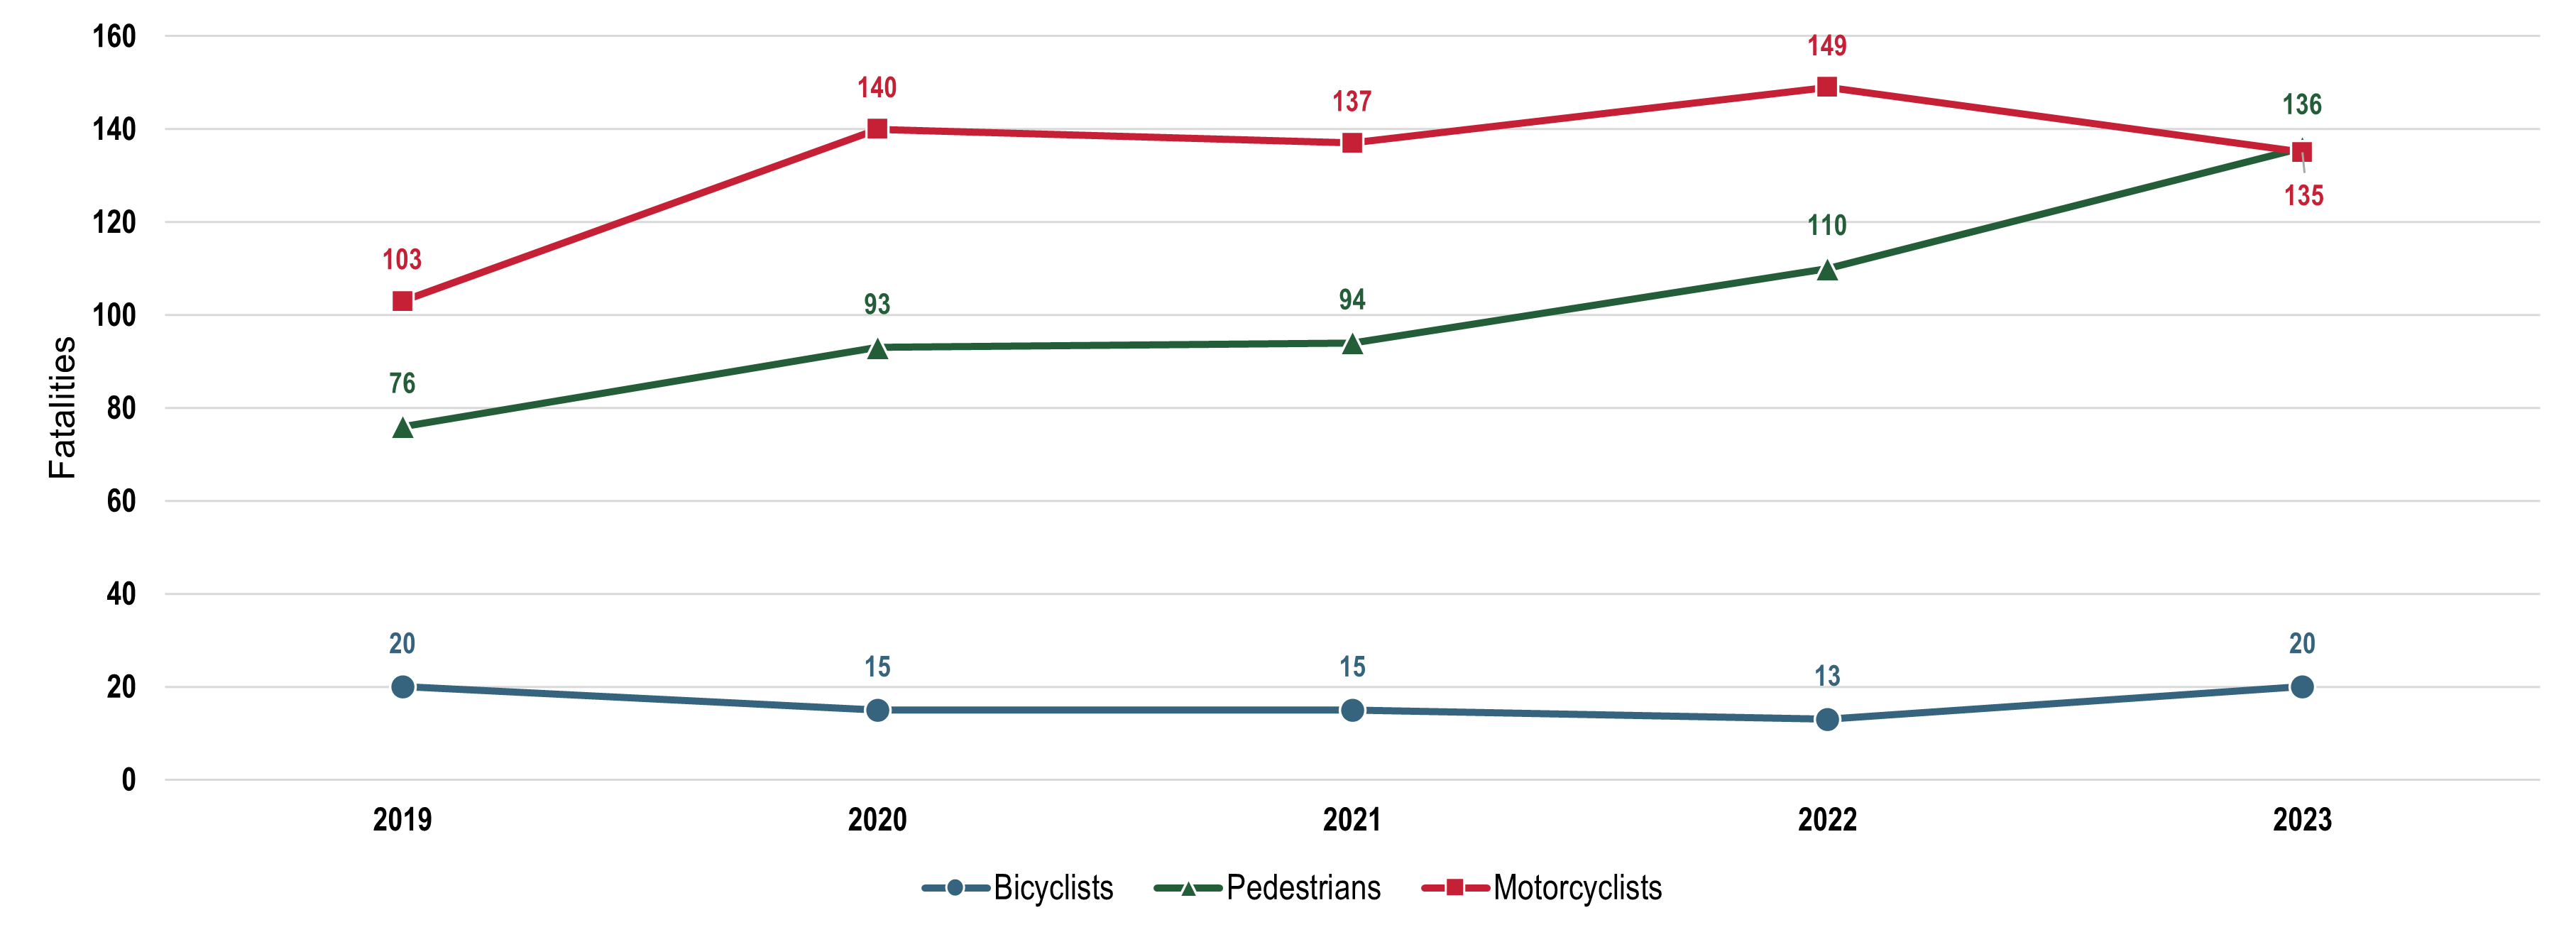
People Fatality Trends
Fatalities by Mode - Graph
Fatalities by Mode - Table
| 2019 | 2020 | 2021 | 2022 | 2023 | |
|---|---|---|---|---|---|
| Total Fatalities per Year | 199 | 248 | 246 | 272 | 292 |
| Bicyclists | 20 | 15 | 15 | 13 | 20 |
| Pedestrians | 76 | 93 | 94 | 110 | 136 |
| Motorcyclists** | 103 | 140 | 137 | 149 | 136 |
The data provided above for the most recent year is considered preliminary. Please refer to the Fatality Analysis Reporting System (FARS) through the National Highway Traffic Safety Administration (NHTSA) for the most accurate fatality data for the state of Colorado. The data source of the data above is the Colorado Department of Transportation crash database. Reference more crash data and key transportation safety data information.

Modes
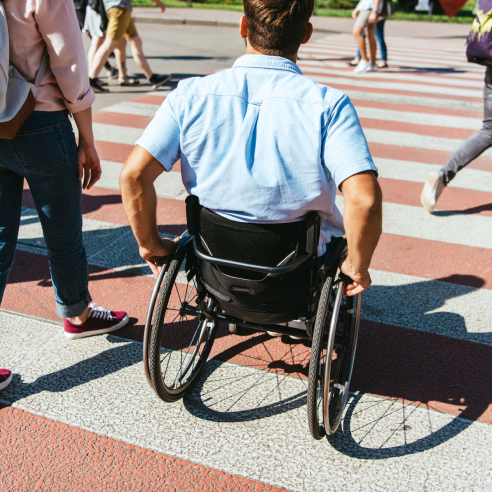
Vulnerable Roadway Users
Vulnerable Roadway Users (VRUs), including pedestrians, bicyclists, wheelchair users, and others who lack the physical protection of a vehicle, are overrepresented in serious and fatal crashes on Colorado’s roadways. Targeted interventions aim to reduce these risks and create safer conditions. For pedestrians, this includes protected crosswalks, pedestrian refuge islands, bump-outs, grade-separated crossings, and signal enhancements like leading pedestrian intervals. Ensuring infrastructure complies with ADA standards and formalizing desire paths also reduces conflict points. The SHSP identifies the following strategies to reduce VRU-related crashes.
Strategies
- SP11: Analyze pedestrian and bicycle crash types
- SP12: Improve VRU exposure data
- SP13: Conduct road safety audits (RSA)
- SP14: Perform regional pedestrian/bicyclist studies
- SP15: Analyze VRU crash demographic data
- SP16: Conduct VRU before-and-after studies
- SP17: Educate traffic safety professionals on VRU best practices
- SP18: Inventory VRU infrastructure
- SP19: Expand VRU data sources
- SP20: Evaluate VRU priority locations
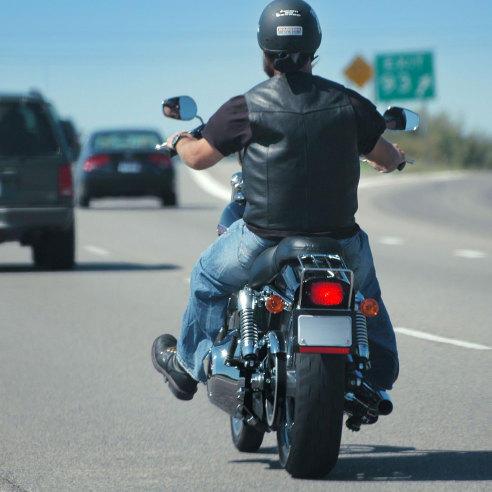
Motorcyclists
Motorcyclists, like pedestrians and bicyclists, lack physical protection during a collision despite traveling at similar speeds to a car. Due to their smaller size, motorcyclists are particularly vulnerable to roadway departure crashes and collisions caused by other drivers failing to detect them. While infrastructure improvements like better curve design and reduced left-turn conflicts can help, much of motorcycle safety depends on the behavior of both riders and drivers. Colorado’s strategies to improve motorcyclist safety focus on education, enforcement, and protective gear use.
Strategies
- SP01: Expand motorcycle operator safety training
- SP02: Increase public awareness of motorcycle safety
- SP03: Improve motorcycle licensing and endorsement
- SP04: Increase helmet and other PPE use
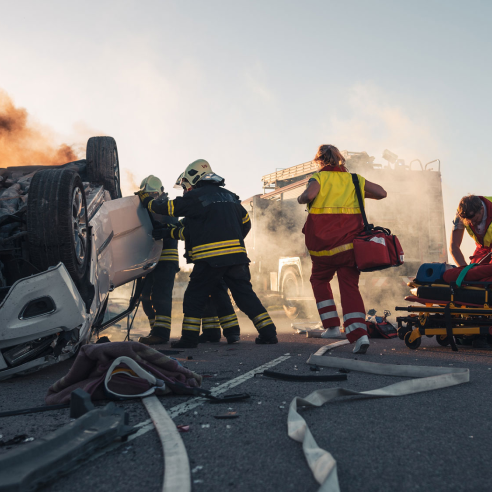
First Responders
Anyone who arrives at the scene of a crash, whether police officers, paramedics, firefighters, tow operators, or maintenance personnel, is considered a first responder. Since crashes often occur on active roadways that still need to carry traffic, effective traffic incident management is crucial to protect the safety of those on scene. Secondary crashes caused by traffic queueing account for a significant portion of incidents. The recent expansion of the Slow Down, Move Over law requires vehicles to move over one lane or slow to safe speeds when passing stationary vehicles, including those responding to a collision. In addition to the law, the SHSP recommends additional resources and support for first responders.
Strategies
- SP22: Provide resources and support for first responders
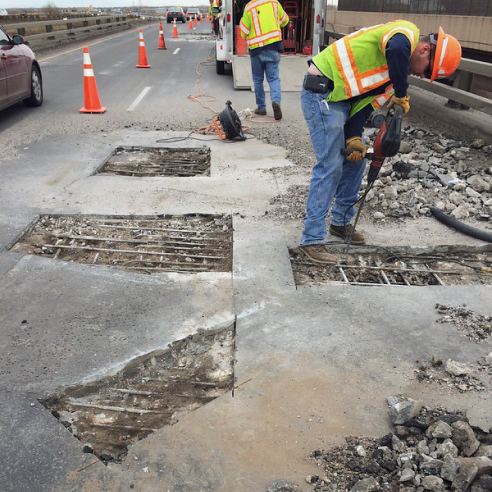
Work Zones
Work zones, defined by NHTSA as areas where roadwork occurs and may involve lane closures, detours, or moving equipment, can pose significant risks for both workers and drivers. The presence of heavy machinery, changing traffic patterns, and close proximity to moving vehicles make these environments especially hazardous. Strategies to improve work zone safety include enhanced traffic control setup, requiring workers to wear Personal Protective Equipment (PPE) and driver education and enforcement in work zones. The SHSP recommends a work zone safety committee to assist implementation of effective protective strategies.
Strategies
- SP21: Create work zone safety committee
Vulnerable Drivers
Fatalities by Age - Graph
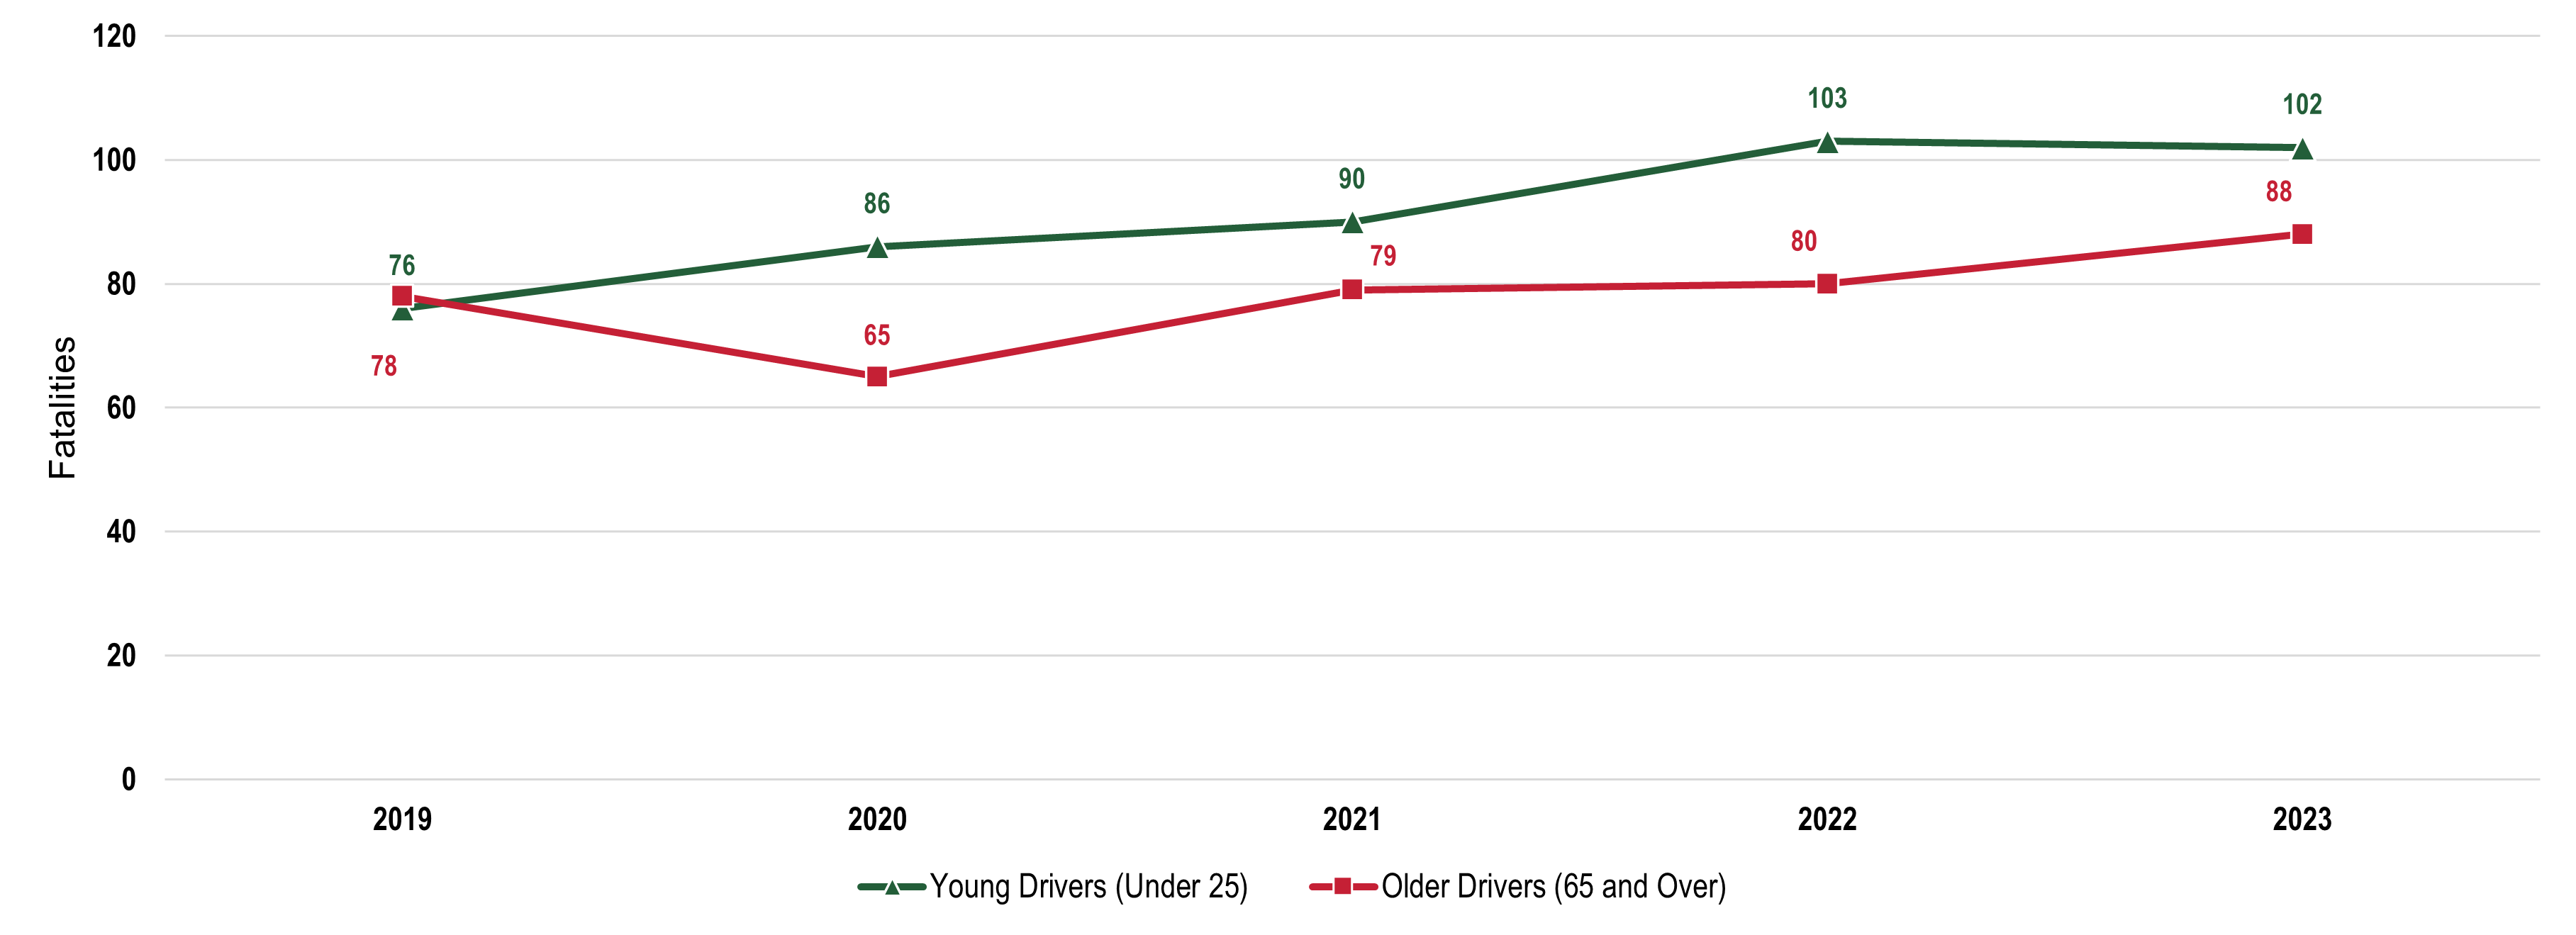
Fatalities by Age - Table
| 2019 | 2020 | 2021 | 2022 | 2023 | |
|---|---|---|---|---|---|
| Young Drivers (Under 25) | 76 | 86 | 90 | 103 | 102 |
| Older Drivers (65 and Over) | 78 | 65 | 79 | 80 | 88 |
The data provided above for the most recent year is considered preliminary. Please refer to the Fatality Analysis Reporting System (FARS) through the National Highway Traffic Safety Administration (NHTSA) for the most accurate fatality data for the state of Colorado. The data source of the data above is the Colorado Department of Transportation crash database. Reference more crash data and key transportation safety data information.
Aging Drivers
As Colorado’s population ages, ensuring the safety and mobility of older drivers is essential. While aging alone does not determine driving ability, changes in vision, reaction time, and cognitive function can increase crash risk. Many roadways and traffic control systems were not originally designed with older drivers in mind. To better support this population, infrastructure enhancements that improve visibility, more alternative transportation options, and educational resources for older adults and families are recommended strategies in the SHSP.
Strategies
- SP05: Improve visibility of traffic control devices
- SP06: Improve sight distances
- SP07: Expand community-based mobility options
- SP08: Enhance and expand resources for aging drivers

Young
Drivers
NHTSA defines young drivers as those between 15 and 20 years old. These drivers are typically new to driving and still developing the skills and experience needed to navigate the road safely. This lack of experience can contribute to a higher risk of crashes. The SHSP recommends strategies that bolster driver education programs to build young drivers’ skills and confidence behind the wheel.
Strategies
- SP09: Expand access to driver’s education
- SP10: Improve quality of driver’s education

Additional Tools & Resources
Safety Portal
Find current safety statistics, read related safety plans, explore data dashboards and learn about our funding programs.
Get Involved
Contact Us
Sign up for safety newsletters and contact the ATS Planning and Implementation Team!